Monitor
Watch live HTTP traffic in a real-time terminal dashboard.
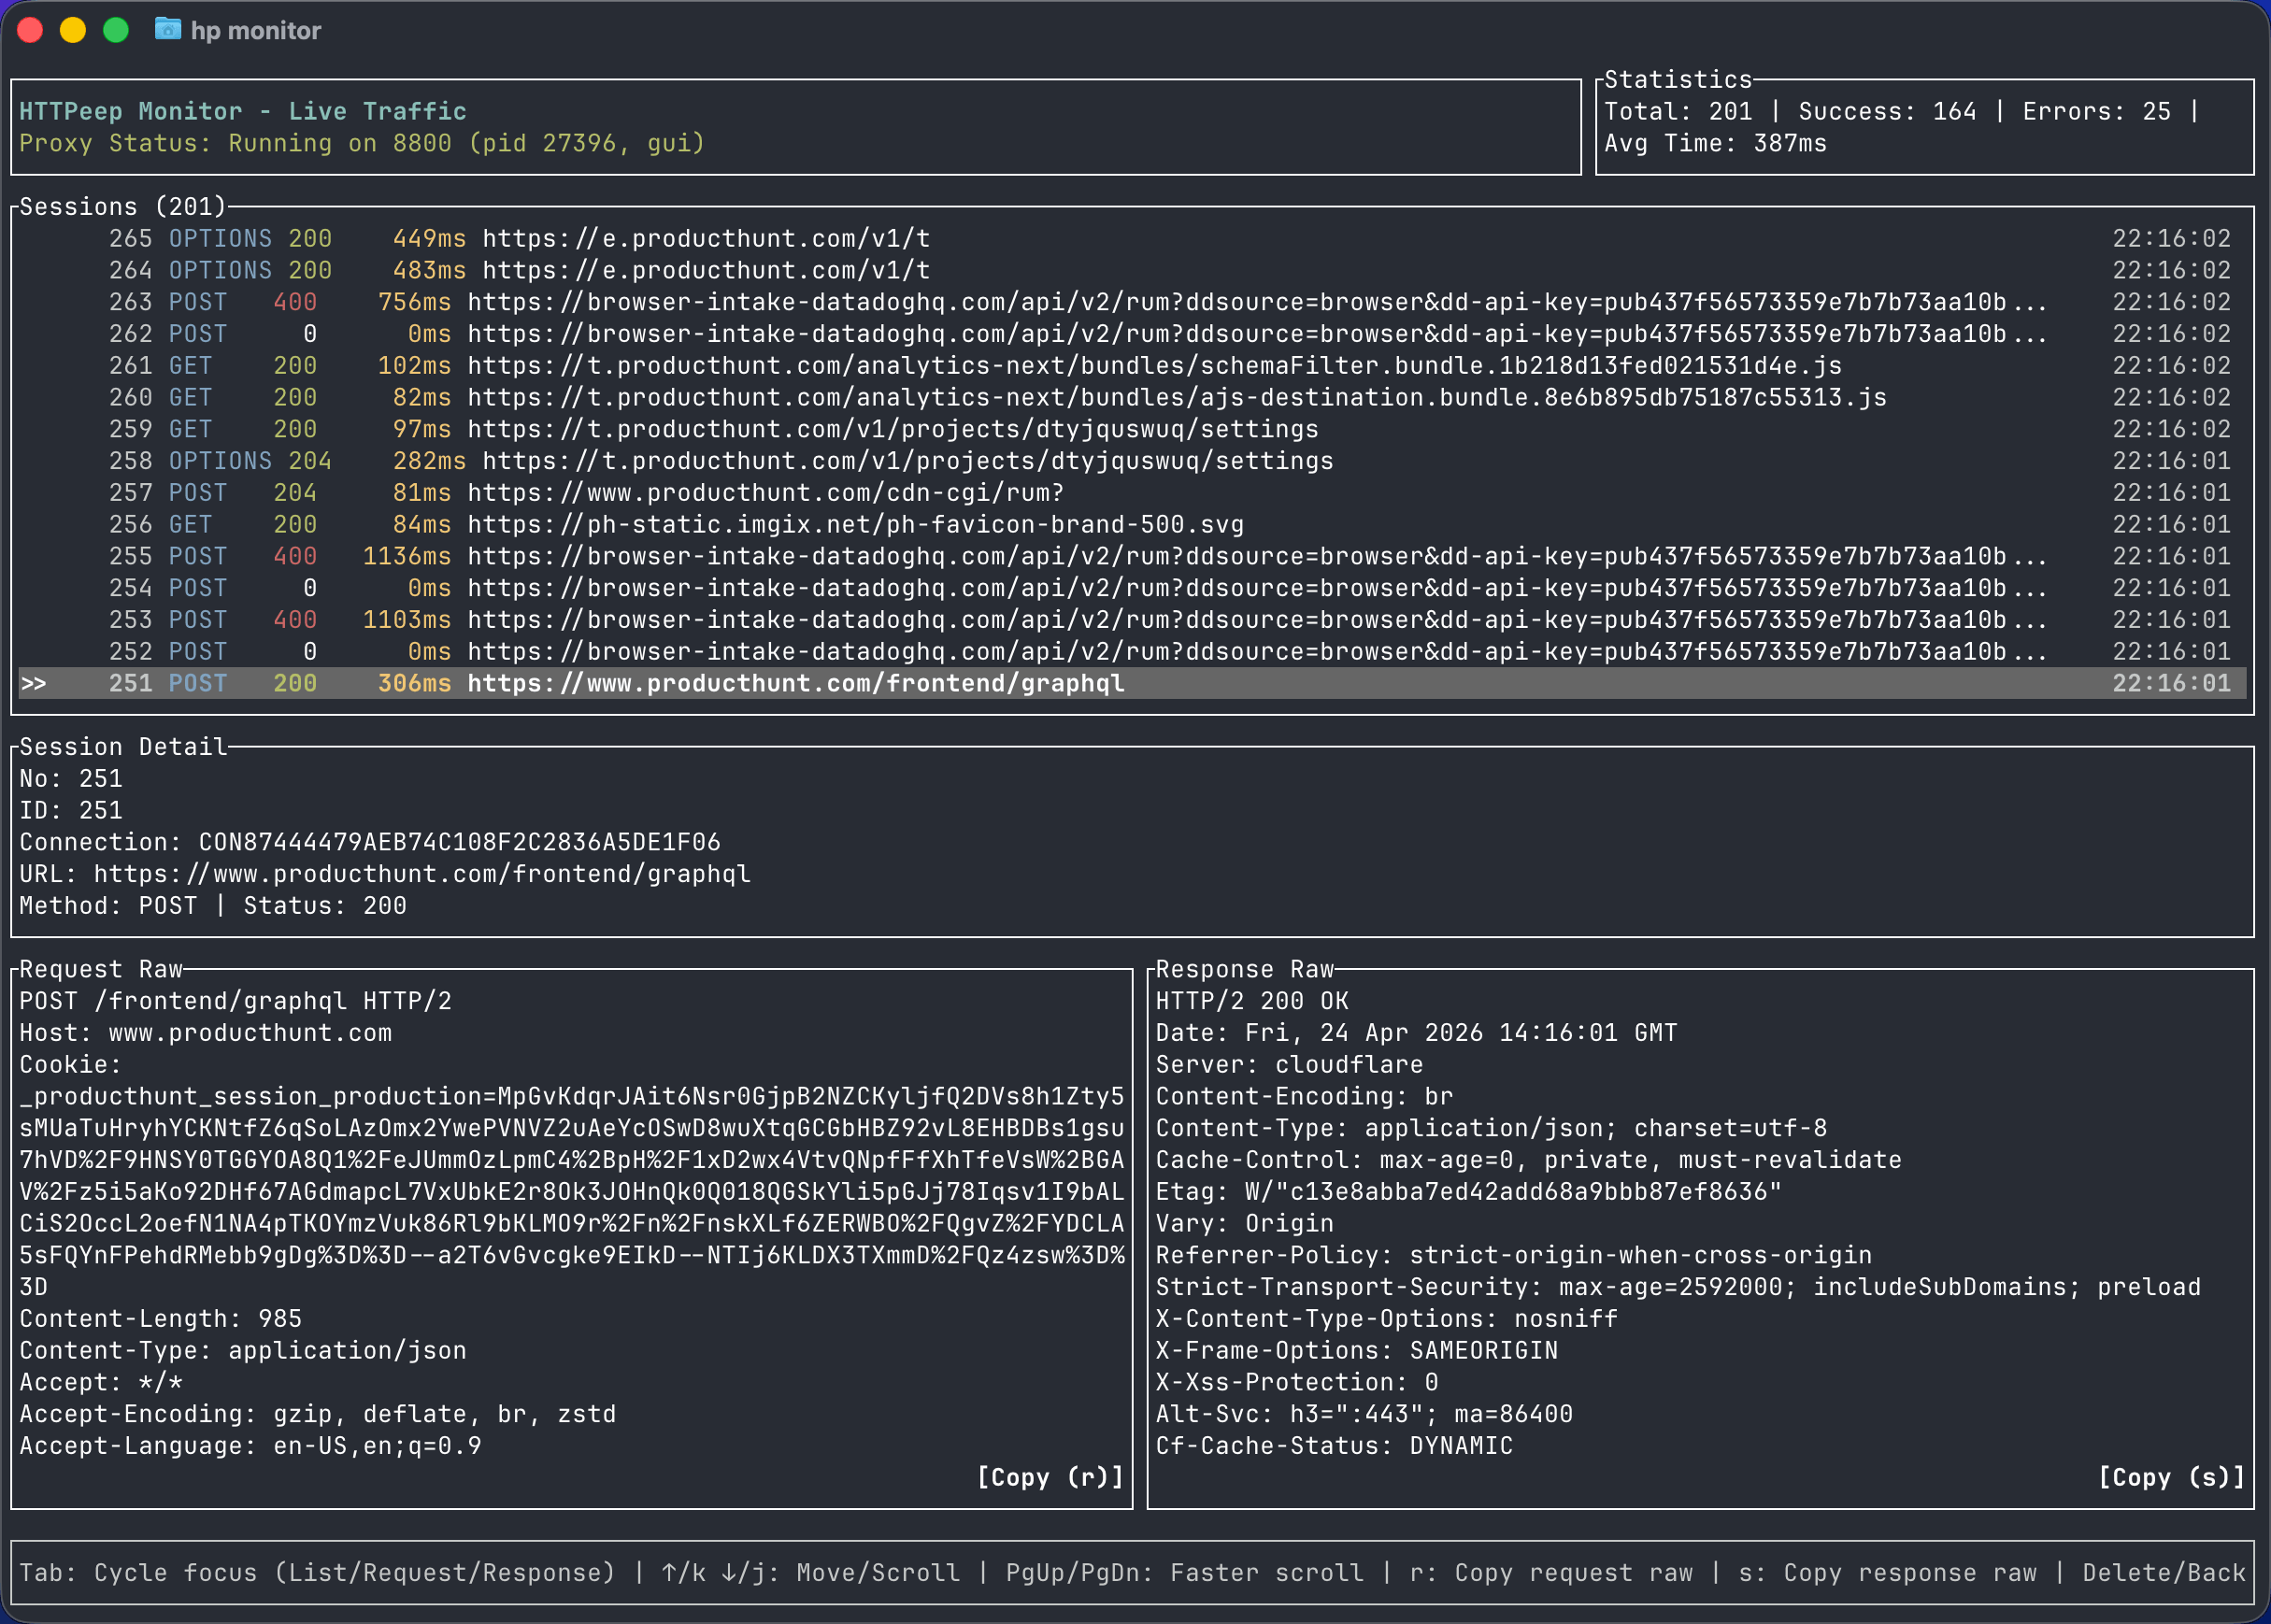
The monitor command launches an interactive terminal dashboard showing live traffic as it passes through the proxy. It is useful for watching traffic patterns in real time without switching to the desktop UI.
Start the monitor
httpeep-cli monitorThe dashboard displays:
- Live session stream — incoming requests with status codes color-coded by class (2xx green, 4xx yellow, 5xx red)
- Request rate — requests per second over a rolling window
- Error rate — percentage of requests returning 4xx or 5xx responses
- Top hosts — hosts ranked by request count in the current window
- Slowest endpoints — endpoints with the highest average response time in the current window
Keyboard controls
| Key | Action |
|---|---|
q | Quit the monitor |
f | Change filters |
? | Show help |
The monitor requires the proxy engine to be running. If you see no traffic, confirm the proxy is active with httpeep-cli proxy status and that your application is routing requests through it.